Going, going…
June 1, 2025
Islandix has been sitting on the sidelines of the 2025 Trump Trade War but now finds itself with insufficient cash to re-start production. Islandix will wind down in phases with sales closed first, closed now.
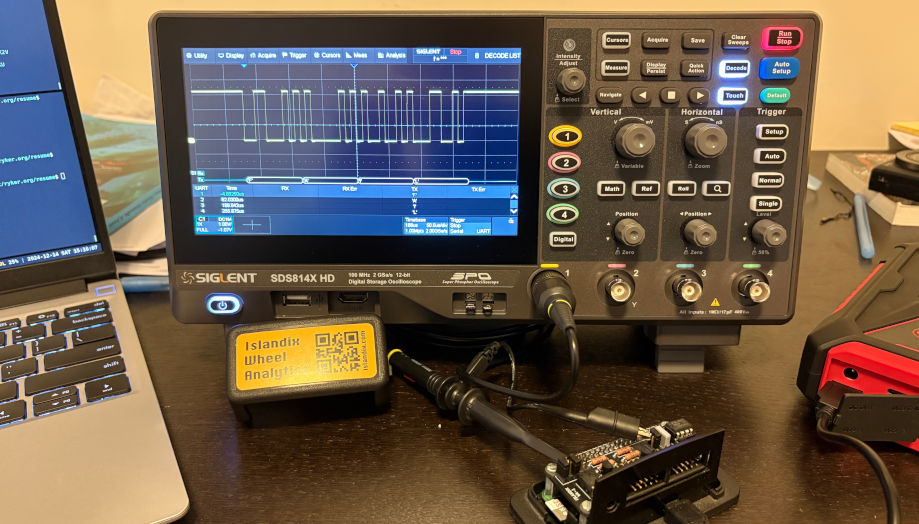
While that’s a bummer, remember Islandix tools were purposely designed so you own them. They do not use cloud functions or require subscriptions (subscription business models are for assholes). Islandix tools working today will continue to work as they always have.
With sales discontinued, our phone line is now disconnected. Email support will continue but expect a daily cadence instead of hourly. For the best experience interacting with volunteer support staff, ensure your messages are marked by kindness and patience. Plenty of parts will be retained to support tools in the field but don’t expect service beyond stated terms. If you are easygoing, parts and service may be available for re-sold Islandix tools and those out of warranty.
If anyone is interested in purchasing the Islandix intellectual property, it’s available for as little as $1 plus an employment contract.