Annual report 2021
December 24, 2021
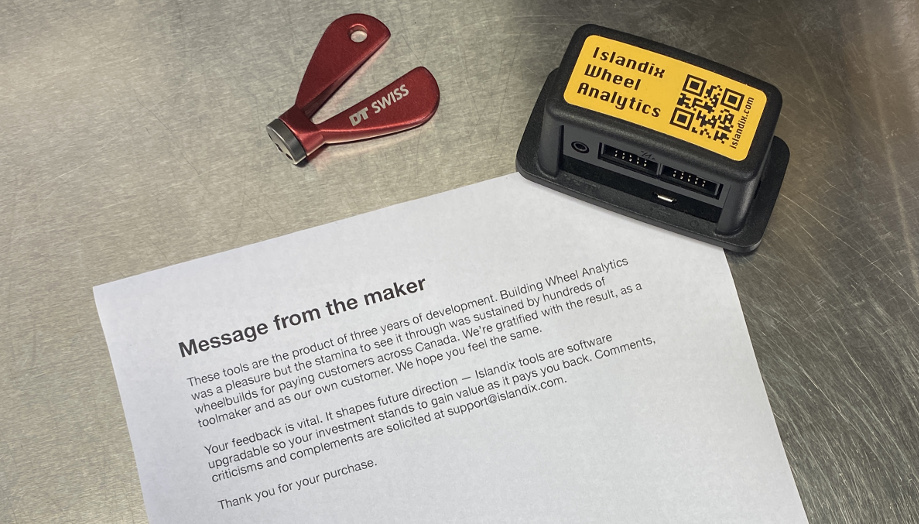
What follows is a retrospective on the first anniversary transistor truing. How we got here, how it’s going and next steps.
What follows is a retrospective on the first anniversary transistor truing. How we got here, how it’s going and next steps.
This is a quick demo of Live Tensio. With no extra effort you get primary metrics for tension range and balance. Control by foot pedal means the relationship between your hands and the wheel is unchanged.
This is Live Tensio, part of Islandix Wheel Analytics. In version 1.0.6 Live Tensio gets a performance upgrade. Here I’m surveying wheel tension to decide what services should be recommended to the owner. I’m working quickly so the screen moves fast. The top area shows live tension as I work my way around the wheel. Values are displayed in kilograms but it works in Newtons too. Each time I tap the left foot pedal, it records the current reading for the left side of the wheel. Live Tensio automatically calculates min, max and average tension as I go. The distribution of tension values is visualized in a bar graph for each side of the wheel. Each horizontal tick represents 5% deviation. Use the graph to recall tension for any given spoke. Hover with the mouse or tap a touchscreen for more information. It turns out this wheel’s in rough shape and the customer will need a re-tensioning service.
Transcription of video
Update: the user interface in this demo has been revised considerably.
Wheel Analytics doesn’t check for software updates so you might not know what you’re missing. The WA-1 doesn’t connect to the internet at all but perhaps worth a rethink in this case.
Software version 1.0.5 was released this week. There are a few improvements but a couple worth mentioning. Truing visualizations now zoom to use available screen space automatically. Bigger is better. And all visualizations have improved printable versions for saving or sharing. This is a free update available via the Update tab on your Wheel Analytics tool.
Did you know the Wheel Analytics manual is available online? The first half covers installation and configuration. The second half is all about wheelbuilding with color diagrams that unpack each visualization in detail. Feedback is welcomed on documentation just as much as on the tools themselves. Please email if you have any comments or questions.
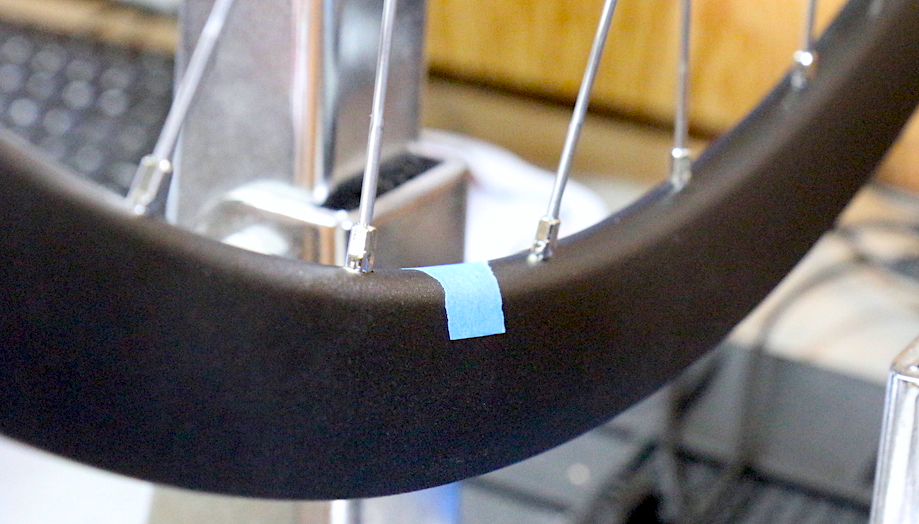
If you true bicycle wheels using indicators, dial or digital, you’ll know the joint area can be problematic on some rims. A little twist or bump can wreak havoc, sending your instrument to the moon if only for a moment. It’s possible to work around this problem.
Normally truing is oriented from the valve hole, starting at the valve hole and continuing around the wheel until returning to the valve hole again. It’s nothing special other than being a signpost to indicate you’ve covered the whole wheel. Instead start at the joint. Begin scanning immediately after the joint and continue around the wheel until returning to the point immediately before the joint. This factors out hyperlocal distortion at the seam. If you need to make the joint more conspicuous, apply a little piece of masking tape to establish your own signpost.
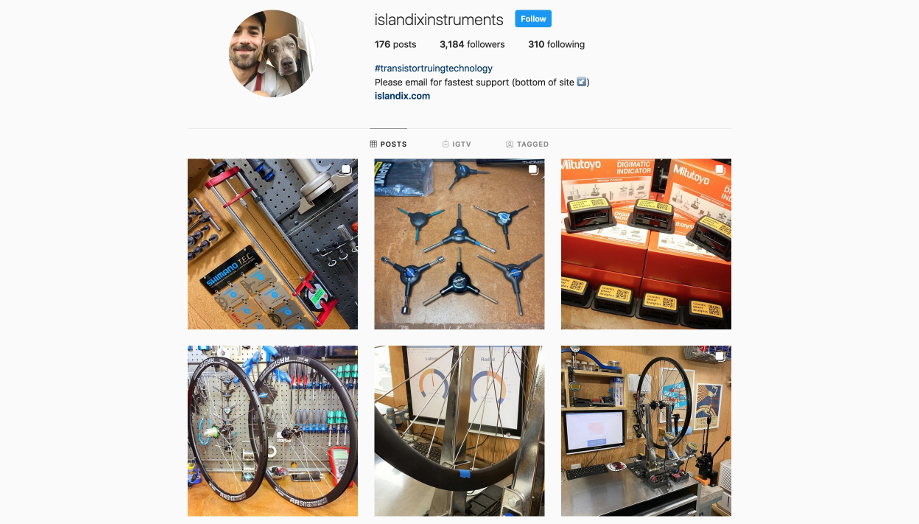
Islandix is low-key on the social media front but check out Instagram . IG gets used for highlights, behind-the-scenes stuff and less serious amusements. As a special request please contact us here for sales and support (we do not use social media every day and some weeks not at all).
Refitting a tensio to work with Wheel Analytics can be pretty easy. In this video we’ll refit a typical tool, this one imported from Asia but similar to tensiometers from a dozen or more manufacturers. This particular tool is well-constructed with a ball bearing pivot. The factory dial indicator is its weakness but we’ll replace it with a digital upgrade.
The indicator is released by loosening a single set screw on the back of the tool. With the indicator removed, the stem is measured. There are two common sizes — 9.5mm (3/8″) and 8mm (5/16″) — and this tool uses the latter. Mitutoyo 543-781B features an 8mm stem so it’s a direct replacement. Insert into the bore and secure with the same screw. Job done.
Compatible indicators are commonly available in most global markets or available direct from Islandix.
Wheel Analytics includes three modules for interfacing with bicycle tensiometers. This feature is evolving and will be the subject of a free update available next month.
One frequently asked question concerns tensiometer support. Wheel Analytics works with any tensiometer equipped with a Mitutoyo or compatible digital indicator. Many tensios can be retrofitted with such an indicator, allowing you to continue using the tool you already own and enjoy. Islandix supplies indicators for this purpose with no extra shipping cost. Please inquire for specific advice or to order indicators.
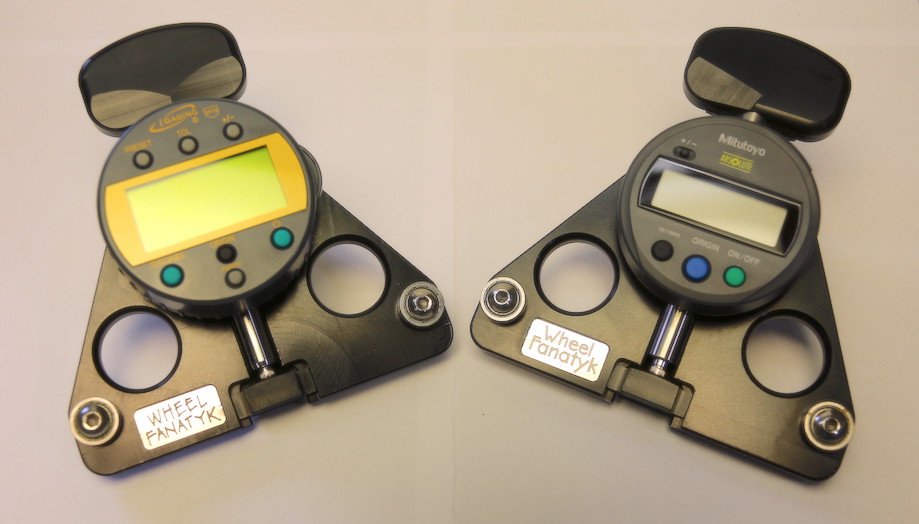
A related question concerns available tensiometers that are compatible out of the box. There are a few on the market. The Wheel Fanatyk tools pictured above are an Islandix favorite. Choose the Digimatic version for compatibility. Wheel Fanatyk tensios are calibrated to a universal standard and this information is preloaded into Wheel Analytics as a default setting. On the other hand if you prefer a more traditional tool, IceToolz makes one featuring a Mitutoyo indicator.

Wheel Analytics uses a web browser interface. This post explains how we got here, what it means and what it doesn’t.
Fundamental to visualization is a way to display graphics. This could be accomplished by selling a screen, which comes with a cost and bakes in certain limitations. If you prefer a larger display or prefer the display you already own, an included screen does you no favors.
If the end user supplies the display platform, how are visualizations rendered? Providing apps is one option but it’s expensive to support every operating system so we’d have to pick and choose. And apps require ongoing maintenance, for example when platforms update. By using a browser as the rendering engine mechanics can (i) work from any device, (ii) upgrade them at will and (iii) switch anytime. With Wheel Analytics there are no apps to install because every platform has a browser already.
The browser connects directly to the WA-1 controller, either over Wifi or USB. Everything happens within your workshop — in no case does the browser connect to any off-site service. This is deliberate and has important implications. There are no cloud components that can fail or be withdrawn. If your internet goes down, Wheel Analytics is unaffected.
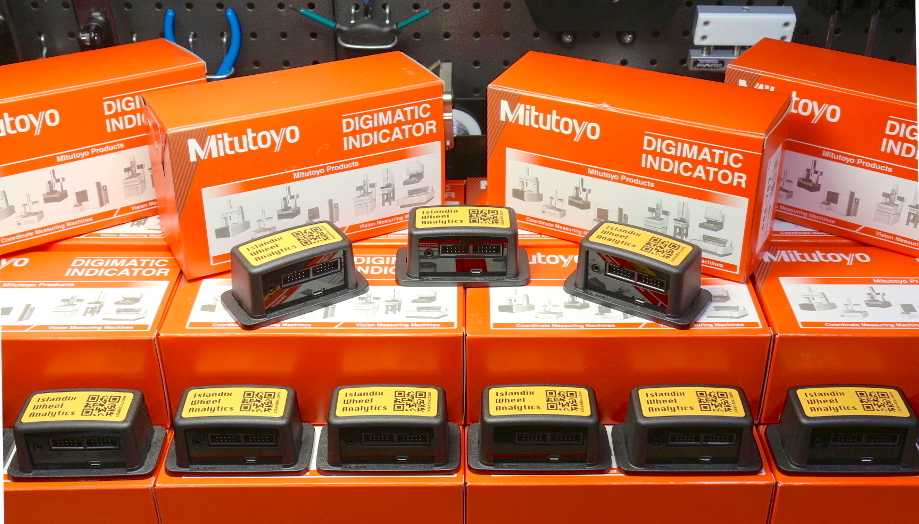
Wheel Analytics is now in stock. Tools are available for use with your own indicators or can be bundled with an optional kit, currently featuring made-in-Japan Mitutoyo indicators (model 543-782). Mitutoyo are highly refined, long-lasting instruments that offer exceptional battery life.
Efforts will be made to keep Wheel Analytics in stock but the optional indicators are liable to vary depending on availability, price and customer preference. Your thoughts on the subject are solicited.